Bible charts: A practical guide to studying Scripture
Bible charts: A practical guide to studying Scripture
Bible charts turn large amounts of Scripture into visual relationships you can understand quickly. They help you see where a book belongs, how events unfold, which people are connected, and how themes develop across the Bible.
A chart is not a replacement for reading the biblical text. It is a study aid that organizes information around a specific question. Used carefully, it can make unfamiliar books easier to approach and help you compare passages without losing their original setting.
Bible charts arrange information in a visual format such as a timeline, flowchart, comparison list, family tree, map-based sequence, or categorized diagram. The format depends on the question you are asking. A timeline may clarify the order of major events, while a book chart may show authorship traditions, audience, setting, purpose, and literary form.
The main benefit is context. A short passage can be difficult to interpret when it is separated from the surrounding book, historical period, or argument. A well-designed chart gives you a framework before you examine individual verses.
Book charts organize the Bible by section, genre, likely setting, or purpose.
Timeline charts place major events, rulers, journeys, and periods in a proposed sequence.
People charts connect family relationships, leaders, prophets, disciples, and other figures.
Theme charts trace subjects such as covenant, kingdom, worship, justice, wisdom, or redemption.
Comparison charts place parallel accounts or related passages side by side.
Geography charts connect places with journeys, battles, missionary activity, or important events.
Charts are especially useful when you are beginning a study, reviewing material, teaching a group, or trying to identify connections between books. They can also reveal where your knowledge is uncertain. If you cannot confidently place an event or explain a relationship, that gap becomes a useful question for further study.
Use charts as maps, not as substitutes for the text. Every chart reflects choices about dates, categories, sources, and interpretation. Check important details against the biblical passage and, when needed, a reliable study resource.
The main types of Bible charts for personal study
Bible book charts
A Bible book chart gives you a quick view of the Bible’s major sections. It may divide the books into the Old Testament and New Testament, then organize them by groupings such as Law, history, poetry, prophets, Gospels, Acts, letters, and apocalyptic writing. Some traditions use different collections or ordering, so the chart should identify the tradition it represents.
A more detailed book chart can include the traditional title, approximate length, literary form, major themes, key figures, and relationship to neighboring books. For example, a chart may place the four Gospels together while showing that each presents Jesus’ ministry with its own emphasis and structure.
These charts help you answer practical questions: Where should I begin reading? Which books cover similar periods? Which letters are associated with a particular church or individual? What kind of writing am I about to read?
Bible timeline charts
A timeline chart places events in chronological order, although biblical chronology often requires caution. Some dates are debated, some accounts focus on theology rather than strict sequence, and different scholars make different judgments about how passages fit together.
A useful timeline may include broad periods such as creation traditions, the patriarchs, the exodus, the settlement of Israel, the monarchy, exile, return, the life and ministry of Jesus, and the growth of the early church. It can also include selected rulers, prophetic ministries, journeys, and major covenant moments.
Timeline charts are helpful for connecting books that overlap historically. Several prophets, for example, spoke during periods also described in the historical books. Seeing those relationships can explain why a prophet addressed a particular political crisis or spiritual problem.
Genealogy and family charts
Family charts show relationships among people named in Scripture. They can clarify the descendants of Abraham, the tribes of Israel, royal lines, priestly connections, and family relationships surrounding Jesus and the early church.
Genealogies should be handled with care. Biblical genealogies may serve theological, legal, tribal, or historical purposes, and they do not always provide every generation. Similar names can also refer to different individuals. A chart should distinguish between what the text states directly and what has been inferred from several passages.
Theme and word-study charts
Theme charts follow an idea through several books or sections of Scripture. A chart about covenant, for example, might list major covenant passages and describe the people, promises, signs, responsibilities, and setting associated with each one.
Word-study charts can list occurrences of an important term, but a repeated word does not automatically have the same meaning everywhere. The surrounding sentence, literary setting, audience, and original language all matter. A strong chart records the passage and summarizes its meaning rather than treating a word as a simple definition that never changes.
Character and leadership charts
Character charts organize information about people such as Moses, David, Ruth, Esther, Peter, Paul, or Mary. Useful categories include background, role, major actions, strengths, failures, relationships, turning points, and the way other biblical writers describe the person.
This format can prevent a one-sided reading. A character may show courage in one scene and serious weakness in another. Recording the full narrative helps you avoid reducing a person to a single famous event or treating every action as a model to imitate.
Comparison charts for parallel passages
Comparison charts place related accounts together. The four Gospels are the most familiar example, but parallel passages also appear in the historical books, prophetic literature, Psalms, and New Testament letters.
Compare the passages for shared details and distinct emphases. Differences should not be erased simply to make the accounts appear identical. Each writer may select, arrange, or describe material for a particular audience and purpose. A chart can show both the common event and the features that are unique to each account.
How to read a Bible chart without losing context
Begin by identifying the chart’s purpose. Ask what the creator is trying to organize: books, events, people, places, themes, or parallel passages. A chart that tries to show everything at once may look impressive but provide little help because the categories are too broad.
Next, check the chart’s labels and assumptions. Terms such as traditional date, probable setting, or scholarly proposal signal different levels of certainty. A date printed in a clean row can look exact even when the evidence supports only a general period.
Then read the passages connected to the chart. If a timeline places a prophet during a certain reign, read the relevant introductions and passages for that prophet. If a theme chart lists covenant references, examine the surrounding chapters rather than relying only on the verse numbers.
Read the chart title and legend. Find out what its symbols, colors, abbreviations, and date ranges mean.
Separate stated facts from interpretations. Mark which details come directly from Scripture and which reflect a proposed reconstruction.
Open the surrounding passage. Read enough context to understand the speaker, audience, situation, and purpose.
Compare related passages. Look for agreement, development, and differences in emphasis.
Write a limited observation. Record what the chart helps you see without claiming more than the evidence supports.
Reading a chart from left to right or top to bottom can create a false sense of certainty. Some charts use visual order for convenience, not because every event has a firmly established sequence. Treat the layout as an organizing tool and pay attention to explanatory notes.
How to make your own Bible charts step by step
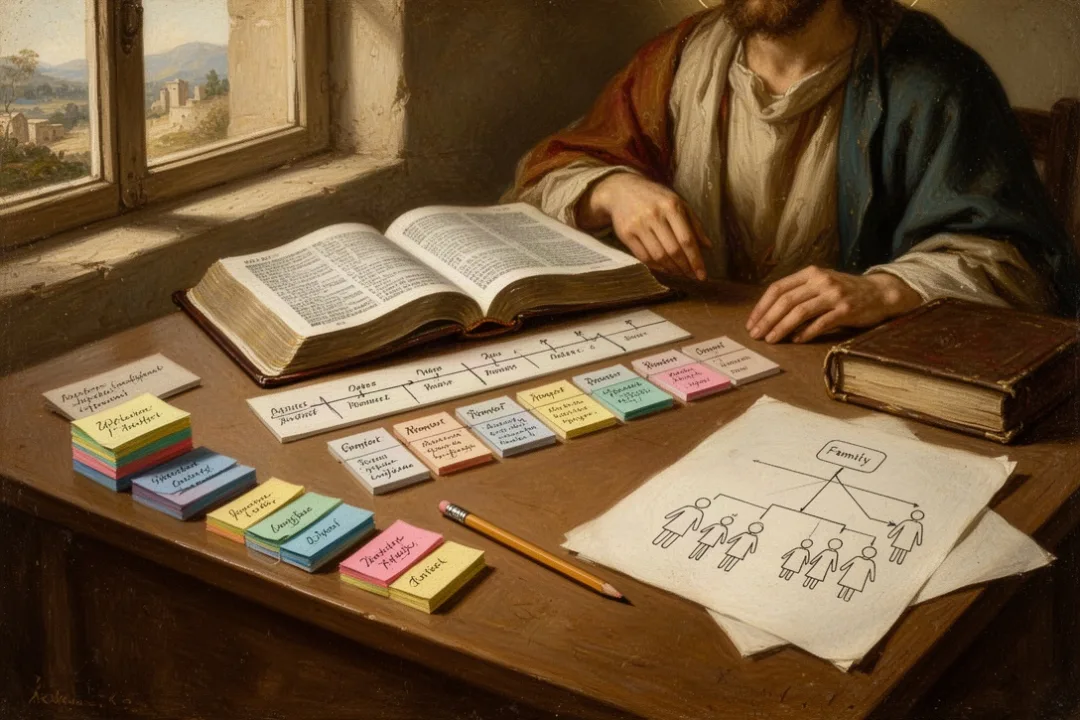
Creating a chart forces you to decide what matters, what belongs together, and what remains uncertain. You can use paper, a spreadsheet, a word processor, or a simple diagram tool. The method matters less than the quality of your categories and the accuracy of your references.
Choose one focused question
Start with a question narrow enough to answer. “What does the Bible teach?” is too broad for one chart. Better questions include: Which events define the exodus story? How does a particular letter address its audience? Where do the Gospels record a certain period of Jesus’ ministry? Which passages describe the responsibilities of Israel’s kings?
A focused question determines the chart’s columns and prevents unnecessary information from crowding out the main idea.
Collect passages before assigning conclusions
List the relevant passages first. Read each one in context, record the reference, and summarize what it actually says. Avoid beginning with a conclusion and selecting only the verses that appear to support it.
For a chart on prayer, for example, you might record who is praying, what the prayer concerns, what response is requested, and what follows. That approach produces more useful information than simply collecting every occurrence of the word “prayer.”
Use consistent categories
Choose categories that can be applied to every entry. A character chart might use name, setting, role, relationships, actions, and outcome. A book chart might use title, genre, audience, setting, purpose, and major themes.
Consistent categories make comparison possible. If one row contains a full biography and another contains only a name, the chart will look complete while giving you an uneven picture.
Mark uncertainty honestly
Use labels such as explicitly stated, strongly suggested, and uncertain when the evidence differs. You can also add a question mark or a note explaining why a date or identification is debated.
This is particularly important for chronology, authorship, geographical identification, and harmonizing parallel narratives. A responsible chart shows where the biblical text is clear and where interpretation requires caution.
Revise the chart after reading
Your first version will often expose missing passages or weak categories. Return to the text and revise the chart rather than forcing new information into a poor structure. Remove details that do not help answer the original question.
A useful chart is usually selective. The goal is not to reproduce an entire study Bible on one page; it is to make a particular relationship visible.
Practical tips and common mistakes when using Bible charts
Good charts simplify information without distorting it. These habits can help you use them more accurately and make your own charts easier to read.
Do not treat a visual sequence as unquestionable chronology. Check whether the order is explicit or proposed.
Do not confuse a chart’s category with a biblical category. Modern labels can be useful, but the text may not use them in the same way.
Do not build doctrine from isolated chart entries. Examine the broader passage and compare relevant texts.
Do not ignore literary form. Poetry, narrative, wisdom writing, prophecy, letters, and apocalyptic literature communicate in different ways.
Do not assume similar names identify one person. Verify each person’s family, location, period, and role.
Do not use color as proof. Colors organize information; they do not establish meaning or importance.
Do record references beside every claim. This makes the chart easy to check and revise.
Do leave room for notes. Questions and uncertainties are part of responsible study.
Do compare more than one reputable resource when dates matter. Different charts may reflect different assumptions.
Common mistake: forcing every biblical detail into one harmonized timeline. Some passages provide sequence, while others emphasize meaning, pattern, or theological significance rather than a precise chronology.
Using Bible charts for different study goals
Personal reading plans
A book chart can help you choose a reading path that matches your purpose. You might read a Gospel from beginning to end, pair a historical book with related prophetic passages, or study a New Testament letter alongside the issues addressed in it.
For a first pass through an unfamiliar book, record only its setting, structure, repeated ideas, and major movements. A simple chart keeps you engaged with the whole book instead of encouraging you to jump randomly between isolated references.
Small-group discussion
Charts give a group a shared reference point. A timeline can help members place a passage in its historical setting, while a comparison chart can support discussion about how two accounts present the same event.
Keep the chart readable on a printed page or shared screen. Give the group one clear task, such as identifying changes in a character’s decisions or tracing how a theme develops from one passage to another.
Teaching children and teenagers
Young learners often benefit from simple visual structure, but simplicity should not become distortion. Use a limited number of events, people, or categories, explain unfamiliar terms, and distinguish clearly between what Scripture says and what the chart is helping them organize.
A map of journeys, a family relationship diagram, or a sequence of major events can support memory. Follow the visual activity with direct reading from the biblical text so students connect the chart to the passage itself.
Preparing a sermon or lesson
Charts can help a teacher identify the movement of a passage. A narrative chart might track conflict, decisions, consequences, and resolution. A letter chart might show the progression from greeting to teaching, correction, encouragement, and closing instructions.
Use the chart during preparation, but do not let it replace interpretation. The central question remains what the passage communicates in its literary and historical setting. A chart should serve that question, not supply an artificial outline.
How digital and printable Bible charts differ
Printable charts are easy to annotate, display, and use away from a screen. They work well for a single book, short timeline, or classroom handout. Their limitation is space: too many entries can make small print and crowded columns difficult to use.
Digital charts can include links, search functions, expandable notes, and multiple layers of information. A spreadsheet is useful when you want to sort passages by book, theme, person, or date. A diagram tool is better for relationships, journeys, and branching structures.
Digital convenience can also encourage information overload. If every entry contains several links and long notes, the chart becomes a database rather than a quick study aid. Keep the main view concise and place extended explanations in separate notes.
How to judge whether a Bible chart is reliable
Look for clear references, stated assumptions, and an explanation of disputed details. A reliable chart does not pretend that every question has one universally accepted answer. It distinguishes direct biblical statements from conclusions based on comparison, tradition, or historical reconstruction.
Consider the creator’s purpose and background. A chart designed for devotional reading may organize themes differently from one designed for academic chronology. Neither format is automatically wrong, but each should be used for the purpose it can actually serve.
Are the Scripture references complete and easy to verify?
Does the chart identify its translation, terminology, or interpretive framework when relevant?
Are uncertain dates and disputed identifications labeled?
Does the chart preserve differences between parallel passages?
Are quotations and summaries faithful to their surrounding context?
Does the layout clarify the information, or merely make it look authoritative?
Study Bibles, Bible dictionaries, maps, commentaries, and academic reference works can help you evaluate a chart. Compare explanations rather than choosing a chart solely because its design is attractive or its claims seem simple.
Examples of useful Bible chart projects
A beginning reader could create a four-column book chart with the book name, literary type, main setting, and central question. This project builds familiarity with the Bible’s structure without requiring detailed conclusions about authorship or chronology.
A reader studying the life of David might create a chart with the passage, location, major decision, immediate result, and later consequence. This keeps the study anchored in the narrative and makes it easier to observe development over several chapters.
Someone studying the theme of wisdom could list passages from Proverbs, Job, Ecclesiastes, the Psalms, and the New Testament. Columns might include speaker, situation, description of wisdom, contrast with foolishness, and practical response. The chart would show both recurring ideas and differences among the books.
A group studying the resurrection accounts might use a comparison chart with the passage, people present, location, message received, response, and later appearance. The purpose would not be to flatten the accounts into one version, but to see what each Gospel emphasizes.
When a Bible chart is not the right study tool
Charts are less helpful when the main issue is the emotional force, literary beauty, or detailed argument of a passage. A spreadsheet may list the movements of a psalm, but it cannot fully convey the experience created by its imagery and prayerful voice.
Charts can also be unhelpful when a reader uses them to avoid sustained reading. A list of themes does not provide the same understanding as following an argument through a letter or watching a narrative develop across chapters. Use the chart to support attention, not to replace it.
If a chart creates more confusion than clarity, simplify it. Reduce the number of categories, separate historical information from theological observations, and return to the primary passages. The best chart is the one that helps you ask better questions and read with greater care.
Frequently asked questions
Are Bible charts accurate?
Bible charts can be accurate when they clearly distinguish direct information from interpretation and provide references for their claims. Chronologies, authorship details, genealogies, and geographical identifications may involve differing views. Check the chart’s notes, compare it with the biblical text, and consult more than one trustworthy reference when a point is disputed.
What is the best Bible chart for beginners?
A basic chart of the Bible’s books is usually the best starting point. Include each book’s section, literary type, broad setting, and one or two major themes. After becoming familiar with that structure, add a simple timeline or character chart. Starting with limited categories prevents the information from becoming overwhelming.
Can I make Bible charts without special software?
Yes. Paper, index cards, a spreadsheet, or a word processor can all work well. Begin with the question you want to answer, choose consistent columns, add passage references, and mark uncertain details. Specialized software may make rearranging information easier, but it is not necessary for a useful chart.
How should I use a Bible timeline when dates are uncertain?
Treat the timeline as a proposed arrangement rather than an infallible sequence. Look for labels such as approximate, traditional, or debated, and read the passages connected with each event. Broad historical periods are often more dependable than exact years, especially when the biblical text does not provide enough information for a precise date.








Leave a Reply